
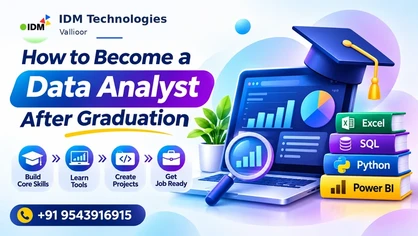
How to Become a Data Analyst After Graduation: Complete Career Roadmap for Freshers
Category: Data Analytics | Career Guidance
Publisher: IDM Technologies, Vallioor
Introduction: Can You Become a Data Analyst After Graduation?
You have completed your degree. Now comes an important question: What skills should you learn to start a successful career?
Many graduates consider software development, digital marketing, accounting or government examinations. But there is another career path worth exploring: Data Analytics.
Businesses collect information about sales, customers, finance, employees, products and marketing campaigns. They need professionals who can study this information and turn it into useful insights.
This is where a Data Analyst plays an important role.
The good news is that you do not necessarily need a Computer Science degree to begin learning Data Analytics.
Graduates from B.Com, BBA, B.Sc, BCA, BA, engineering and other backgrounds can develop the necessary skills through structured learning and practice.
In this guide, you will learn what a Data Analyst does, which tools beginners should study, how to build projects and how to prepare for entry-level opportunities.
1. Who Is a Data Analyst?
A Data Analyst is a professional who examines data to identify patterns, answer questions and support business decisions.
Imagine a retail company has sales records from 20 stores.
Management wants to know:
Which store generates the highest revenue?
Which products sell the most?
Why have sales decreased in certain locations?
Which months show stronger sales performance?
Where should the company investigate opportunities for improvement?
A Data Analyst collects the relevant information, prepares the dataset, performs calculations, creates reports and explains the findings.
The role combines technical skills, business understanding and communication.
2. Can Students from Non-IT Backgrounds Become Data Analysts?
Yes. Data Analytics is an interdisciplinary field.
Different academic backgrounds can provide useful starting knowledge.
Educational Background | Potential Advantage |
|---|---|
Accounting, financial data and business reporting | |
BBA | Business processes, marketing and management |
B.Sc Mathematics | Statistics, numerical analysis and logical reasoning |
B.Sc Computer Science | Programming, databases and data structures |
BCA | Software applications and database fundamentals |
BA Economics | Economic data, statistical interpretation and research |
Engineering | Problem-solving, technical reasoning and mathematics |
These advantages can help, but a degree alone does not establish readiness for an analyst role.
Regardless of academic background, students need to practise working with datasets, analytical tools and business questions.
3. What Skills Are Required to Become a Data Analyst?
A beginner should develop six core areas of competence.
Microsoft Excel
Excel is an excellent starting point because many businesses use spreadsheets for routine reporting and analysis.
Learn formulas, filtering, PivotTables, charts, conditional formatting and data validation.
Then advance to Power Query for importing and transforming datasets.
Practical exercise: Use a sample sales dataset to calculate revenue, average order value and monthly growth.
SQL
SQL helps analysts work with data stored in relational databases.
Learn SELECT, WHERE, GROUP BY, JOIN, aggregate functions, subqueries and window functions.
Practical exercise: Use a retail database to identify the highest-performing product categories.
Power BI
Power BI helps create interactive reports and dashboards.
Learn data connections, Power Query, relationships, data modelling, DAX calculations, chart design and report publishing.
Practical exercise: Create a dashboard showing monthly sales, profit and regional performance.
Python
Python is useful for automating data preparation and conducting more complex analysis.
Begin with programming fundamentals and gradually study Pandas, NumPy and data visualisation.
Practical exercise: Import a CSV file, clean missing values and analyse customer purchasing patterns.
Statistics
Analysts need sufficient statistical knowledge to interpret results accurately.
Study averages, percentages, distributions, standard deviation, correlation, sampling and basic hypothesis testing.
Practical exercise: Compare the average sales performance of two product categories and explain the limitations of the comparison.
Communication and Business Understanding
Analysts must be able to explain what they discovered and why it matters.
Practise writing short summaries, presenting dashboards and describing possible business actions.
A visually attractive dashboard is useful only when its information is accurate and understandable.
4. Step-by-Step Data Analyst Roadmap for Freshers
Following the right learning sequence can make the process more manageable.
Stage | What to Learn | Expected Practical Output |
|---|---|---|
1 | Excel fundamentals | Cleaned sales dataset |
2 | Advanced Excel and Power Query | Automated data preparation workflow |
3 | SQL fundamentals and joins | Business analysis queries |
4 | Power BI and DAX | Interactive sales dashboard |
5 | Python and Pandas | Exploratory Data Analysis notebook |
6 | Statistics and KPIs | Business insights report |
7 | End-to-end projects | Portfolio of documented projects |
8 | Resume, GitHub and interviews | Job application portfolio |
Beginners should avoid learning all tools simultaneously without applying them.
A more effective approach is to study one concept, practise it with a dataset and produce a small working result before proceeding.
5. How Long Does It Take to Learn Data Analytics?
The learning period varies depending on your educational background, practice hours, curriculum and project complexity.
For illustration, a beginner studying consistently might organise learning into the following 24-week plan.
Weeks | Focus |
|---|---|
1–4 | Excel fundamentals, advanced Excel and Power Query |
5–8 | SQL and relational databases |
9–12 | Power BI, data modelling and DAX |
13–16 | Python and exploratory analysis |
17–20 | Statistics and portfolio projects |
21–24 | End-to-end project, resume and interview preparation |
This is an illustrative self-study roadmap, not a guaranteed job-readiness timeline or IDM Technologies' confirmed batch duration.
Students often need additional practice to develop confidence and independent problem-solving abilities.
6. Five Data Analytics Projects Every Fresher Can Try
Projects are valuable because they demonstrate the ability to apply analytical skills.
Project 1: Retail Sales Dashboard
Tools: Excel, SQL and Power BI.
Analyse product-wise revenue, profit, sales growth and regional performance.
Deliverable: An interactive dashboard accompanied by a summary of business findings.
Project 2: Student Performance Analysis
Tools: Excel and Power BI.
Study attendance, marks and subject-wise results.
Deliverable: A report showing academic performance trends using anonymised or sample data.
Project 3: E-Commerce Analysis
Tools: SQL and Python.
Analyse customer purchases, product categories and order values.
Deliverable: A customer behaviour report supported by SQL queries and Python calculations.
Project 4: HR Analytics Dashboard
Tools: Excel and Power BI.
Analyse department headcount, attrition, attendance and employee distribution.
Deliverable: A dashboard presenting key workforce indicators.
Project 5: Digital Marketing Campaign Analysis
Tools: Excel, SQL and Power BI.
Analyse campaign spend, enquiries, conversions and revenue.
Deliverable: A dashboard comparing cost per lead, conversion rate and return on investment.
For every project, clearly explain the business question, dataset, cleaning method, calculations, visualisations and limitations.
7. How to Build a Data Analytics Portfolio
A project portfolio helps employers understand what you can actually do.
Start with two or three complete projects rather than collecting many unfinished examples.
Each portfolio project should include:
A clear business problem.
Information about the dataset.
Data-cleaning procedures.
SQL queries, formulas or Python notebooks.
Dashboard screenshots.
Key findings.
Limitations and possible improvements.
You can use GitHub to organise technical files and a portfolio webpage to present project summaries.
Do not publish confidential customer, employee or company information without appropriate permission.
8. How to Prepare a Resume for a Data Analyst Role
A fresher's resume should highlight demonstrated skills rather than simply listing software names.
A useful resume structure includes:
Professional summary: Briefly describe your analytical interests and relevant capabilities.
Technical skills: Include tools you have actually used, such as Excel, SQL, Power BI and Python.
Projects: Describe two or three completed projects, the tools used and the outcome.
Education: Include your degree and relevant academic details.
Certifications or training: Add relevant completed programmes, accurately identifying the provider.
For example:
"Developed a Power BI retail sales dashboard using cleaned transactional data, DAX measures and interactive visualisations to analyse monthly revenue and category performance."
Use factual project descriptions. Never invent internship experience, business results or technical accomplishments.
9. Data Analyst Interview Preparation for Freshers
Recruiters may assess technical understanding, practical experience and communication.
Common areas include:
Interview Topic | Example Question |
|---|---|
Excel | What is the difference between VLOOKUP and XLOOKUP? |
SQL | What is the difference between INNER JOIN and LEFT JOIN? |
Power BI | What is the difference between a calculated column and a measure? |
Power Query | How do you combine multiple monthly files? |
Python | How do you handle missing values using Pandas? |
Statistics | What is the difference between mean and median? |
Projects | How did you validate your data and calculations? |
Business analysis | How would you investigate declining sales? |
Practise explaining your approach rather than memorising definitions alone.
A recruiter may ask you to solve a simple analytical problem or explain your previous project decisions.
10. What Are the Career Opportunities After Learning Data Analytics?
Depending on qualifications, skills and employer requirements, freshers can explore roles such as:
Career Role | Main Work |
|---|---|
Junior Data Analyst | Support data cleaning and analysis |
Reporting Analyst | Prepare recurring business reports |
MIS Executive | Maintain information systems and reports |
Business Analyst Trainee | Support business process and requirement analysis |
Junior BI Analyst | Assist with dashboards and reporting |
Operations Analyst | Evaluate operational data |
Marketing Analyst Trainee | Analyse campaign and customer metrics |
Job titles and eligibility vary. Some positions require prior professional experience or stronger domain knowledge.
Training and certifications can support learning, but they do not guarantee a job.
11. How Can AI Help in Data Analytics?
Artificial intelligence can assist with understanding code, generating initial SQL queries, explaining formulas, drafting documentation and suggesting ways to explore a dataset.
For example, a learner might use AI to understand a SQL JOIN error or receive an explanation of a Power BI DAX expression.
However, AI tools may generate incorrect calculations, code or interpretations.
Every AI-generated output must be reviewed and tested. Sensitive business information must also be handled responsibly.
AI assistance is most useful when combined with strong fundamentals and independent analytical thinking.
12. Common Mistakes Beginners Should Avoid
Learning too many tools without practice: Complete useful exercises before moving to the next tool.
Watching tutorials without building projects: Apply concepts through actual data analysis.
Copying dashboards without understanding calculations: Make sure you can explain every important metric.
Ignoring SQL and data preparation: Attractive visualisations cannot compensate for incorrect datasets.
Depending completely on AI: Validate all generated queries, formulas and conclusions.
Expecting immediate placement after training: Build practical competence, strengthen communication and prepare consistently for recruitment.
Avoiding these mistakes helps learners develop genuine analytical abilities.
13. Data Analytics Training at IDM Technologies, Vallioor
If you are a graduate interested in learning Data Analytics, you can explore the training options available at IDM Technologies, Vallioor.
Important learning areas to enquire about include Microsoft Excel, Power Query, SQL, Python, Power BI, statistics, AI-assisted analysis and practical projects.
When selecting a programme, confirm the latest syllabus, course duration, batch timings, project requirements, trainer support and fee structure.
Students from Vallioor and surrounding areas, including Panagudi, Eruvadi, Nanguneri, Kaval Kinaru and Vadakkankulam, can enquire about current training opportunities.
IDM Technologies combines software training with IT-related services, offering learners a local option for exploring technical career skills.
14. Frequently Asked Questions
Can I become a Data Analyst after B.Com?
Yes. B.Com graduates can develop the required analytical and technical skills. Their accounting and business knowledge may be useful for financial analysis and reporting roles.
Is Data Analytics suitable for BBA students?
Yes. BBA graduates may find business analytics, marketing analytics and operations reporting relevant to their background.
Can I become a Data Analyst without coding knowledge?
You can begin learning with Excel and visual tools. However, SQL and Python improve your ability to work with databases and perform more advanced analysis.
Which tool should I learn first?
Excel is a practical starting point for many beginners. SQL, Power BI and Python can follow as your foundational knowledge develops.
Is Power BI alone enough to become a Data Analyst?
Power BI is useful, but many roles also require data preparation, SQL, analytical thinking, communication and an understanding of business metrics.
Do I need a postgraduate degree?
Not necessarily. Entry requirements depend on employers and job roles. Relevant technical ability, projects and a suitable educational background can be important.
Can I learn Data Analytics in Vallioor?
You can contact IDM Technologies, Vallioor, to enquire about Data Analytics course content, batch availability and demo options.
How do I start preparing for a Data Analyst interview?
Strengthen Excel, SQL, Power BI and basic statistics, complete practical projects and practise explaining your analytical decisions.
Conclusion: Start Building Your Data Analytics Career
Becoming a Data Analyst after graduation requires more than learning software names.
You need to understand business questions, prepare reliable datasets, perform analysis, create useful reports and communicate conclusions.
Start with Excel, build your SQL and Power BI skills, learn Python progressively and complete projects that demonstrate your abilities.
Consistent practical learning can help you prepare for entry-level opportunities and make better-informed career decisions.
Explore Data Analytics Training at IDM Technologies
IDM Technologies — Vallioor
Software Training | Web Development | Digital Marketing | IT Services
Interested in developing your Data Analytics skills?
Request information about the current course, syllabus and demo-class availability.
WhatsApp: +91 9543916915
Send: DATA ANALYTICS DEMO
Website: www.idmwebtech.com